Blog » Right Part First Time Metrics That Matter
Right Part First Time Metrics That Matter

Organizations often struggle to measure parts performance because they confuse a stocked part with the correct part. A successful repair requires identifying the component that fits the exact equipment configuration, supplying it in the requested quantity, and completing the service without avoidable corrections. Together, these steps form the basis of right part first time metrics.
When Systems Online helps whole goods manufacturers digitize their manuals, the goal is to make these outcomes visible and measurable. A digital catalog provides the initial identification data, while your business systems handle the fulfillment and service tracking. Connecting those systems allows you to measure whether the correct part reached the field.

Defining the Right Part First Time Sequence
Right part first time is a locally defined outcome spanning identification and fulfillment. Achieving it requires identifying a part for the equipment’s actual configuration, supplying the exact item and requested quantity on the first fulfillment, and using it for the repair without discovering an error. This specific sequence separates parts accuracy from other common supply chain measurements.
While a high first-time fill rate in the warehouse means parts are sitting on the shelf, it does not confirm whether those items belong on the specific machine awaiting service. A high first-time fix rate indicates a successful service visit, but it masks the inefficient parts identification steps that may have occurred before the technician arrived, so equipment manufacturers need a distinct measurement tracking the component from selection to installation.
To measure this outcome, you track four connected stages: selection, availability, fulfillment, and repair outcome. Selection measures your user navigating a catalog to find a valid part number, and availability captures your inventory position at the exact moment of the request. Fulfillment evaluates the warehouse and logistics operation delivering the order, while the repair outcome logs the physical installation.
Deploying electronic parts catalog software like EzParts enables workflows across these stages. Interactive schematics and bill-of-materials-based selection let technicians choose parts in context. The software handles supersession chains automatically, ensuring a technician looking at an obsolete component adds the current replacement part to their cart. Linking that cart directly to your ERP enables accurate ordering, and while software alone does not guarantee a strong KPI result, it provides the structured events you need to calculate one.
Build a Scorecard With Distinct Metrics
A headline rate shows the overall outcome of your parts operation, while component metrics help locate a specific miss. Because tracking only the final installation success leaves you with no diagnostic information when a failure occurs, a scorecard breaks the process into distinct measurements with specific numerators, denominators, time boundaries, and purposes.
The formulas below serve as recommended local definitions to standardize your internal reporting. Establish the denominator, timing, and exclusions for every KPI rather than searching for one universal industry formula.
Identification and fulfillment metrics
A strong measurement program starts with the initial catalog interaction and ends when the shipment arrives. You isolate the selection accuracy from the shipping performance so you can assign corrective actions to the right department.
| Metric | Recommended calculation | Purpose |
|---|---|---|
| Catalog first-selection accuracy | Correct first-selected parts ÷ part-demand lines with verified fit outcomes × 100. | Shows whether the initial catalog selection was correct, before stock and shipping issues enter the picture. Treat a part corrected before ordering as a miss. |
| Right-part-first-time line rate | Part-demand lines correctly identified and fulfilled with the correct part and requested quantity on the first fulfillment ÷ eligible part-demand lines × 100. | Provides a practical headline KPI combining selection and fulfillment. Count a line that is never fulfilled as unsuccessful. |
| First-time fill rate | Part lines available to fulfill at the initial request ÷ all part lines requested × 100. | Measures availability, not fitment or order accuracy. Specify whether "available" means on-hand at the local site or available through a defined fulfillment network. |
| Complete-and-correct first-shipment rate | Orders with every requested line delivered correctly and in full on the initial shipment ÷ eligible orders requiring fulfillment × 100. | Confirms whether the whole parts order was usable upon arrival, separating order completeness from individual line fulfillment. |
| Wrong-part return rate | Lines returned for a part-identification or application error ÷ lines shipped × 100. | Acts as a downstream signal of errors. Requires strict reason codes to separate catalog errors from warehouse picking mistakes or damaged goods. |
Service outcomes and supporting measures
Once the part arrives, the measurement focus shifts to the service bay or field location, where the final installation confirms whether the identification and fulfillment steps were successful.
First-time fix rate: Calculate this as first-time fixes ÷ total fixes × 100. Define your first-visit rule clearly, specifying how you handle follow-up visits caused by parts shortages versus those caused by missing technician skills.
Time to identify: Track the elapsed time from a parts request or catalog search to a validated part selection. Speed is visible to technicians, but it does not prove that the selected part was correct, so pair this supporting measure with an accuracy metric to avoid rewarding fast, incorrect selections.
Outcome coverage: Track the share of part-demand lines with a confirmed fit, installation, return, or other defined outcome. Do not treat unknown outcomes as correct. Show your unknown outcomes separately so missing feedback from the field does not artificially inflate your headline KPI.
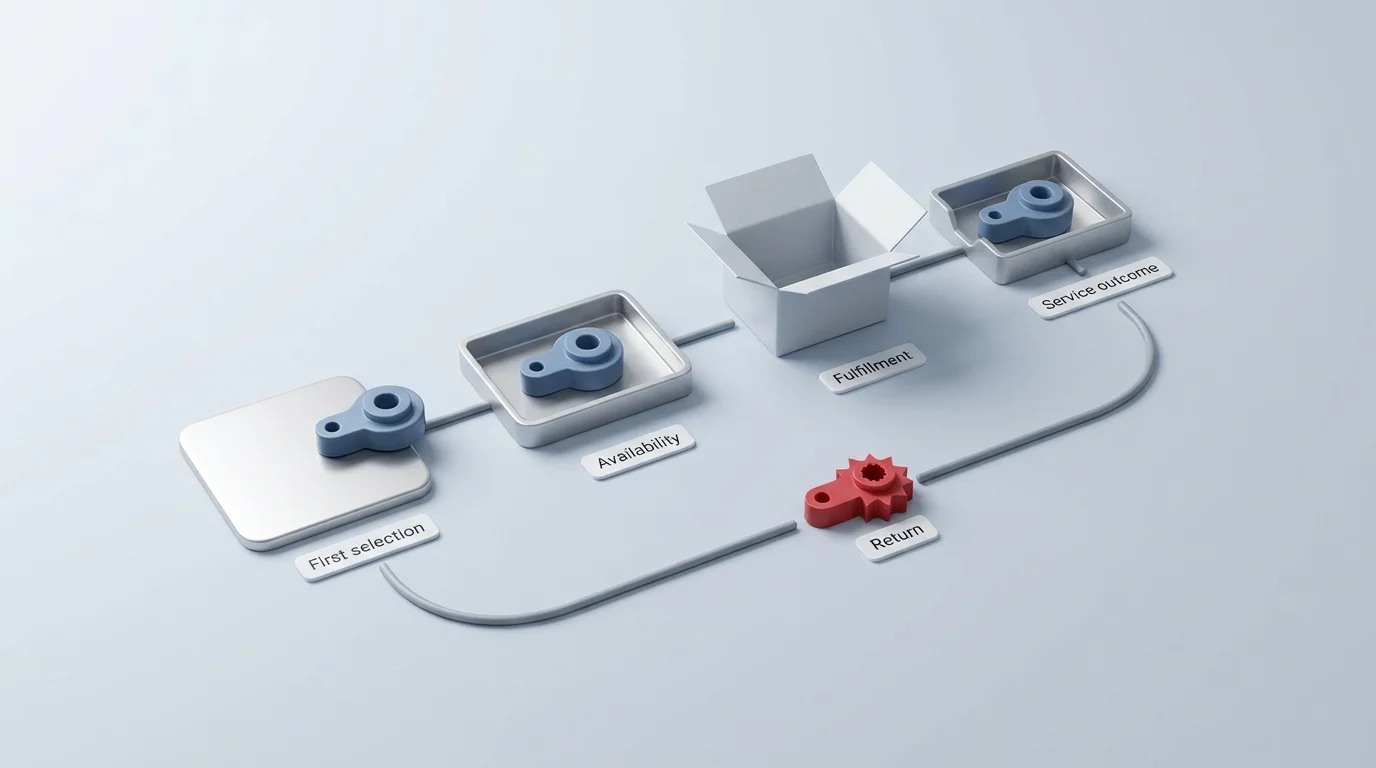
Keep Availability, Accuracy, and First-Time Fix Separate
Each metric on your scorecard answers a different question. Availability asks whether a part could be supplied from current stock, and accuracy determines whether the supplied part fits the equipment configuration. Fulfillment asks whether the warehouse picked and shipped the correct item and quantity, while the first-time fix rate measures whether the overarching service issue was resolved.
Combining these concepts obscures operational realities because a requested line can be available but still be the wrong part for the equipment due to a catalog error. Conversely, an accurate selection might be unavailable due to a supply chain disruption, meaning you must track both paths rather than rolling them into a single fill-rate claim.
The Commercial Food Equipment Service Association provides a clear framework for these distinctions. Its Glossary of Terms defines separate line-, quantity-, and value-based fill measures, and establishes that line fill should be measured at the exact time an order is placed. Adopting similar precision prevents your warehouse and service teams from arguing over ambiguous data.
Relying entirely on line-level measurement creates blind spots for repair operations, which a hypothetical service order requiring five distinct components illustrates clearly. If the warehouse stocks four of those components, the resulting 80% line-fill rate looks healthy on a logistics report, but if the missing fifth component prevents the machine from running, the repair readiness for that order is zero. The National Automobile Dealers Association explains this dynamic in its Managing Your Parts Inventory dealer guide, showing how a strong line-fill rate can hide whether an entire repair order is ready for the technician. You can apply this measurement lesson to your equipment service metrics by tracking transaction-level completeness alongside individual line fill.
Service completion introduces a wider set of variables. ASCM’s 2019 Connected Field Services metric defines a first-time fix as resolving an issue without needing additional expertise, information, or parts, a definition intentionally broader than parts accuracy. A technician might arrive with the correct part, only to discover the equipment requires a specialized tool they left behind, resulting in a failed first-time fix. Measuring the parts metrics separately ensures your catalog team avoids penalties for a dispatch or tooling failure.
Use Wrong-Part Returns as a Diagnostic Signal
A return rate operates as a lagging signal, arriving days or weeks after the initial selection error. It provides valuable diagnostic data, but only if you prevent the warehouse from labeling every inbound item as a "catalog error."
Consistent return reason codes help you distinguish the true cause of the failure. A wrong-part return can result from incorrect catalog application data, a mismatch with the physical equipment configuration, an inaccurate user selection, an order transcription error at the dealer counter, a warehouse picking mistake, shipping damage, intentional multi-ordering, or a sudden change in the customer's repair need. Grouping these distinct failures makes it harder to choose an effective correction.
If a dealer orders a fuel pump using an obsolete part number after ignoring a supersession warning, and the warehouse ships that obsolete part, the failure belongs to the user workflow. Conversely, when the dealer selects the correct modern part number but a warehouse picker grabs the outdated component from an adjacent bin, the error falls on logistics. A third scenario, where the digital catalog points the user to a fuel pump that physically cannot mount to a specific engine serial number, exposes a failure in your fitment data.
Historical automotive data illustrates why these cause codes matter. An October 2017 European automotive aftermarket study commissioned by ACEA surveyed 900 independent repairers across six markets, finding an average parts return rate of 9%, compared with 7% reported by distributor managers. The data showed that 77% of those returned parts were classified under "wrong-part delivery," a broad category combining misidentification, deliberate multi-ordering, missing information, and transcription errors. Without granular codes, distributors could not isolate their catalog accuracy from their customers' ordering habits, which provides strong context to justify rigorous cause codes in your own operation rather than adopting the 9% figure as an equipment target.

Connect Each Request to Its Outcome
A performance indicator remains credible only when a request can be traced from initial selection to a confirmed result. If your digital catalog operates in a silo, separated from your enterprise resource planning (ERP) system and field service management tools, you will spend your measurement meetings arguing over data validity instead of improving parts accuracy.
Set the unit, timing, and eligibility rules
Before pulling reports, define the unit of measurement, whether line, quantity, value, or whole order, and how the calculation treats initial availability, same-day fill, or first-shipment completeness. Also specify whether availability refers to local stock or network-wide fulfillment.
Your calculation also needs rules for customer cancellations, duplicate orders, unfilled demand, and incomplete outcomes. For the headline right-part-first-time rate, count a line that is never fulfilled as unsuccessful; component metrics can then show whether the cause was an identification failure, an availability gap, or a logistics breakdown. Set an observation window for returns or service results so a part returned six months later does not retroactively change a closed reporting period.
Link catalog activity to downstream records
Mapping the entire event chain builds a continuous data trail. The sequence starts with the equipment model or configuration, moves to the initial search and selected part, logs any corrections or supersessions, and registers the order-line ID. From there, it checks inventory status and location, tracks the shipped part and quantity, records any return reason, and finalizes with the service-work-order outcome.
Retain both the initial selection and the final order so user corrections remain visible. If a technician clicks the wrong part, realizes their mistake, deletes it from the cart, and selects the correct part, your digital service manual platform needs to register that workflow. Logging only the final purchased item hides the usability friction that almost caused an error.
Systems Online’s EzParts platform facilitates this tracking by logging schematic and BOM ordering, supersessions, and inventory visibility. Its ERP communication layer passes the exact part details to your external business systems, while EzParts Enterprise analytics monitors catalog searches, page views, and purchases. Because every manufacturing environment uses a different combination of ERP and service management tools, instrumentation and data joins need to be validated for each implementation. The digital catalog generates the selection events, but your data warehouse must link those events to the resulting invoice lines and service tickets.
Mobile catalog software requires an additional layer of validation. Field service technicians often work in remote, disconnected environments, accessing schematics and building parts lists offline. Validate that these offline actions are captured accurately and reconciled after the device syncs with the network. Retain the original event time alongside the later synchronization time if your systems allow it, ensuring your time-to-identify metrics reflect the technician's actual workflow rather than a batch-processing delay.
Turn the Baseline Into Better Decisions
There is no universally good right-part-first-time percentage, as an OEM supporting massive mining excavators faces entirely different parts availability and return tolerances than a manufacturer producing commercial lawnmowers. Establish a baseline using consistent definitions, then set improvement targets for your specific equipment lines, dealer networks, and service workflows. Do not transplant automotive dealership figures to whole-goods equipment without evidence that the populations and calculation rules are comparable.
Segment your results by equipment model, part family, dealer location, catalog release version, fulfillment center, user role, and access channel because a single network average obscures recurring problems. For example, you might discover that your overall right-part-first-time rate sits at 85%, but a specific hydraulic assembly released last quarter is running at 40% due to missing fitment data in the catalog.
Learning to interpret the patterns your scorecard reveals turns data into action. A low first-time fill rate combined with strong selection accuracy points toward a localized availability problem, while frequent selection misses or a spike in application-related returns call for an immediate investigation into your catalog fitment data, configuration capture methods, or the lookup workflow. When orders feature correct parts but ship with the wrong quantities, they indicate a fulfillment breakdown in the warehouse. Finally, a weak first-time fix rate despite strong parts accuracy suggests broader service factors, such as inadequate troubleshooting guides or insufficient technician training.
That pairing matters in practice: if a dealer parts counter cuts its lookup time in half but doubles its wrong-part return rate, the operation loses money on shipping and customer goodwill, proving speed is only valuable when the resulting selection is correct.
The most practical next move is to pilot this scorecard on one product family or a small group of high-performing dealers. Validate your outcome coverage to ensure the field actively reports its installation successes and failures, and adjust your reason codes based on the pilot feedback. Once you confirm the data trail remains intact from the initial schematic click to the final service resolution, you can expand the metrics program across your entire aftermarket operation.
Digitizing your parts data is the first step toward measuring and improving your aftermarket efficiency. Systems Online provides the electronic parts catalog software OEMs need to link interactive schematics with ERP fulfillment, reducing ordering errors and boosting parts sales. Discover how our multi-channel platform supports your service goals at sysonline.com.
Modified on: 11/16/2026